
Data flow diagrams can be used to provide a clear representation of any business function. The technique starts with an overall picture of the business and continues by analyzing each of the functional areas of interest. This analysis can be carried out to precisely the level of detail required. The technique exploits a method called top-down expansion to conduct the analysis in a targeted way.
The result is a series of diagrams that represent the business activities in a way that is clear and easy to communicate. A business model comprises one or more data flow diagrams (also known as business process diagrams). Initially a context diagram is drawn, which is a simple representation of the entire system under investigation. This is followed by a level 1 diagram; which provides an overview of the major functional areas of the business. Don't worry about the symbols at this stage, these are explained shortly. Using the context diagram together with additional information from the area of interest, the level 1 diagram can then be drawn.
The level 1 diagram identifies the major business processes at a high level and any of these processes can then be analyzed further - giving rise to a corresponding level 2 business process diagram. This process of more detailed analysis can then continue see through level 3, 4 and so on. However, most investigations will stop at level 2 and it is very unusual to go beyond a level 3 diagram.
Identifying the existing business processes, using a technique like data flow diagrams, is an essential precursor to business process re-engineering, migration to new technology, or refinement of an existing business process. However, the level of detail required will depend on the type of change being considered.
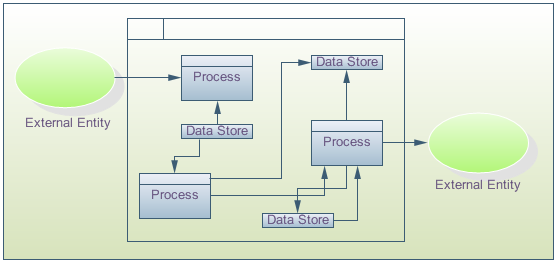
The process model is typically used in structured analysis and design methods. Also called a data flow diagram (DFD), it shows the flow of information through a system. Each process transforms inputs into outputs.
The model generally starts with a context diagram showing the system as a single process flowchart connected to external entities outside of the system boundary. This process explodes to a lower level DFD that divides the system into smaller parts and balances the flow of information between parent and child diagrams. Many diagram levels may be needed to express a complex system. Primitive processes, those that don't explode to a child diagram, are usually described in a connected textual specification.
http://www.edrawsoft.com/Data-Flow-Diagrams.php
http://www.edrawsoft.com/Data-Flow-Diagrams.php
No comments:
Post a Comment